OK.Wahl
Internetpräsentation
Version 2.2.7
Ergebnis zur Landtagswahl 2013 am 15.09.2013
Stimmkreis Neustadt/Aisch-Bad Windsheim, Fürth-Land - Landkreis Neustadt a. d. Aisch - Bad Windsheim - Gemeinde Simmershofen
Es wurden alle Stimmbezirke ausgewertet.
 Diagramm
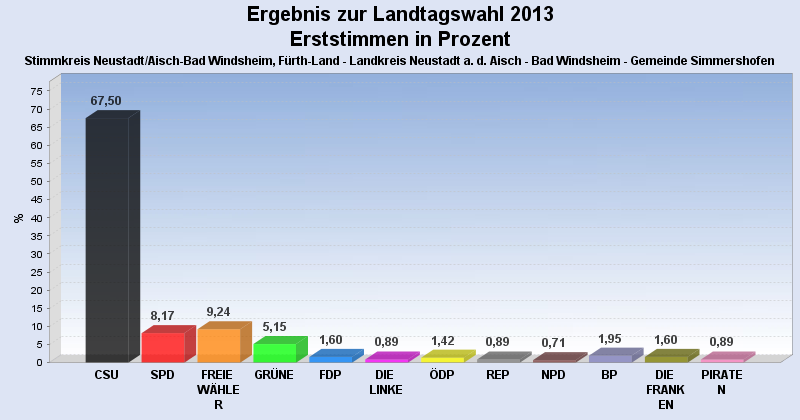
 Seitenanfang
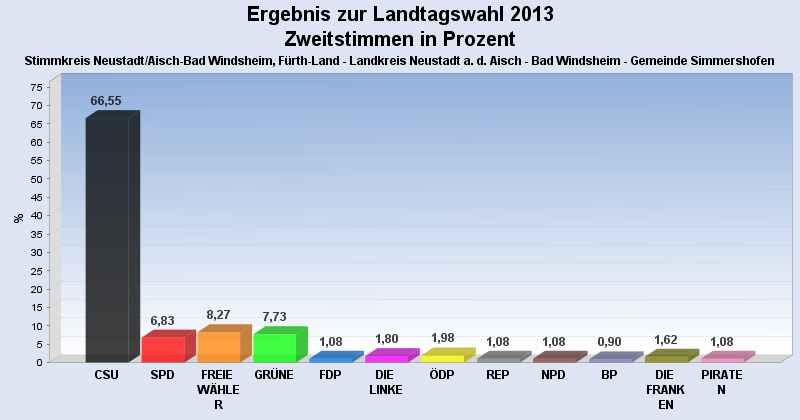
Wahlbeteiligung, Stimmzettel, Stimmen
| Wahlbeteiligung: | 76,93% |
|---|---|
| Stimmberechtigte: | 737 |
| Wähler: | 567 |
| Ungültige Erststimmen: | 4 |
| Gültige Erststimmen: | 563 |
| Ungültige Zweitstimmen: | 11 |
| Gültige Zweitstimmen: | 556 |
Erststimmen nach Wahlvorschlag
| Partei | Erststimmen | Prozent | |
|---|---|---|---|
| 1 | Herold, Hans ( CSU ) | 380 | 67,50% |
| 2 | Scheuenstuhl, Harry ( SPD ) | 46 | 8,17% |
| 3 | Schmidt, Gabi ( FREIE WÄHLER ) | 52 | 9,24% |
| 4 | Schwämmlein, Marianne ( GRÜNE ) | 29 | 5,15% |
| 5 | Peter, Thomas ( FDP ) | 9 | 1,60% |
| 6 | Förster, Henry ( DIE LINKE ) | 5 | 0,89% |
| 7 | Osterlänger, Jürgen ( ÖDP ) | 8 | 1,42% |
| 8 | Hegeler, Horst ( REP ) | 5 | 0,89% |
| 9 | Vahlberg, Richard ( NPD ) | 4 | 0,71% |
| 10 | Abele-Kloha, Heidi ( BP ) | 11 | 1,95% |
| 11 | Kistler, Karola ( DIE FRANKEN ) | 9 | 1,60% |
| 12 | Rosenberg, Raphael ( PIRATEN ) | 5 | 0,89% |
Zweitstimmen nach Wahlvorschlag
| Partei | Zweitstimmen | Prozent | |
|---|---|---|---|
| 1 | CSU | 370 | 66,55% |
| 2 | SPD | 38 | 6,83% |
| 3 | FREIE WÄHLER | 46 | 8,27% |
| 4 | GRÜNE | 43 | 7,73% |
| 5 | FDP | 6 | 1,08% |
| 6 | DIE LINKE | 10 | 1,80% |
| 7 | ÖDP | 11 | 1,98% |
| 8 | REP | 6 | 1,08% |
| 9 | NPD | 6 | 1,08% |
| 10 | BP | 5 | 0,90% |
| 11 | DIE FRANKEN | 9 | 1,62% |
| 12 | PIRATEN | 6 | 1,08% |
- Stand: 19.09.2013 10:08:27