OK.Wahl
Internetpräsentation
Version 2.2.7
Ergebnis zur Landtagswahl 2013 am 15.09.2013
Stimmkreis Neustadt/Aisch-Bad Windsheim, Fürth-Land - Landkreis Neustadt a. d. Aisch - Bad Windsheim - Markt Oberscheinfeld
Es wurden alle Stimmbezirke ausgewertet.
 Diagramm
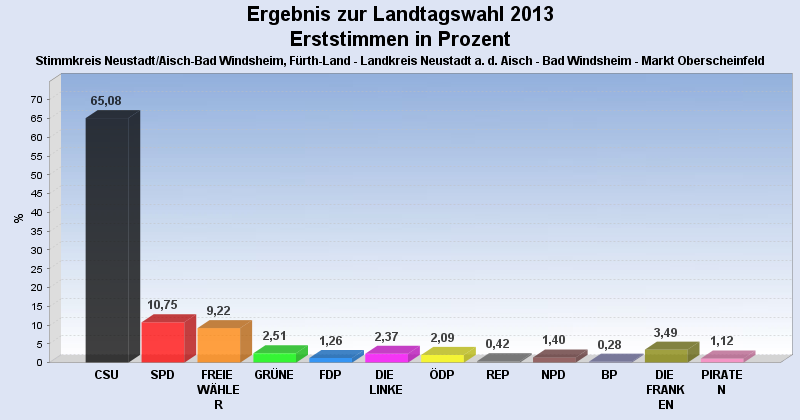
 Seitenanfang
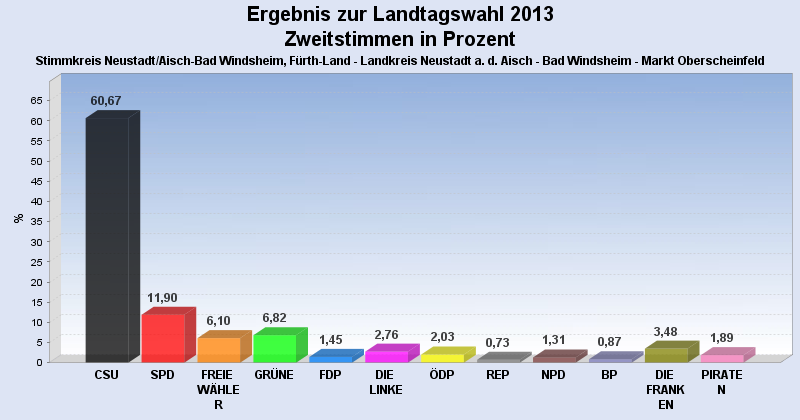
Wahlbeteiligung, Stimmzettel, Stimmen
| Wahlbeteiligung: | 74,90% |
|---|---|
| Stimmberechtigte: | 964 |
| Wähler: | 722 |
| Ungültige Erststimmen: | 6 |
| Gültige Erststimmen: | 716 |
| Ungültige Zweitstimmen: | 33 |
| Gültige Zweitstimmen: | 689 |
Erststimmen nach Wahlvorschlag
| Partei | Erststimmen | Prozent | |
|---|---|---|---|
| 1 | Herold, Hans ( CSU ) | 466 | 65,08% |
| 2 | Scheuenstuhl, Harry ( SPD ) | 77 | 10,75% |
| 3 | Schmidt, Gabi ( FREIE WÄHLER ) | 66 | 9,22% |
| 4 | Schwämmlein, Marianne ( GRÜNE ) | 18 | 2,51% |
| 5 | Peter, Thomas ( FDP ) | 9 | 1,26% |
| 6 | Förster, Henry ( DIE LINKE ) | 17 | 2,37% |
| 7 | Osterlänger, Jürgen ( ÖDP ) | 15 | 2,09% |
| 8 | Hegeler, Horst ( REP ) | 3 | 0,42% |
| 9 | Vahlberg, Richard ( NPD ) | 10 | 1,40% |
| 10 | Abele-Kloha, Heidi ( BP ) | 2 | 0,28% |
| 11 | Kistler, Karola ( DIE FRANKEN ) | 25 | 3,49% |
| 12 | Rosenberg, Raphael ( PIRATEN ) | 8 | 1,12% |
Zweitstimmen nach Wahlvorschlag
| Partei | Zweitstimmen | Prozent | |
|---|---|---|---|
| 1 | CSU | 418 | 60,67% |
| 2 | SPD | 82 | 11,90% |
| 3 | FREIE WÄHLER | 42 | 6,10% |
| 4 | GRÜNE | 47 | 6,82% |
| 5 | FDP | 10 | 1,45% |
| 6 | DIE LINKE | 19 | 2,76% |
| 7 | ÖDP | 14 | 2,03% |
| 8 | REP | 5 | 0,73% |
| 9 | NPD | 9 | 1,31% |
| 10 | BP | 6 | 0,87% |
| 11 | DIE FRANKEN | 24 | 3,48% |
| 12 | PIRATEN | 13 | 1,89% |
- Stand: 19.09.2013 10:08:17