OK.Wahl
Internetpräsentation
Version 2.2.7
Ergebnis zur Landtagswahl 2013 am 15.09.2013
Stimmkreis Neustadt/Aisch-Bad Windsheim, Fürth-Land - Landkreis Neustadt a. d. Aisch - Bad Windsheim - Markt Obernzenn
Es wurden alle Stimmbezirke ausgewertet.
 Diagramm
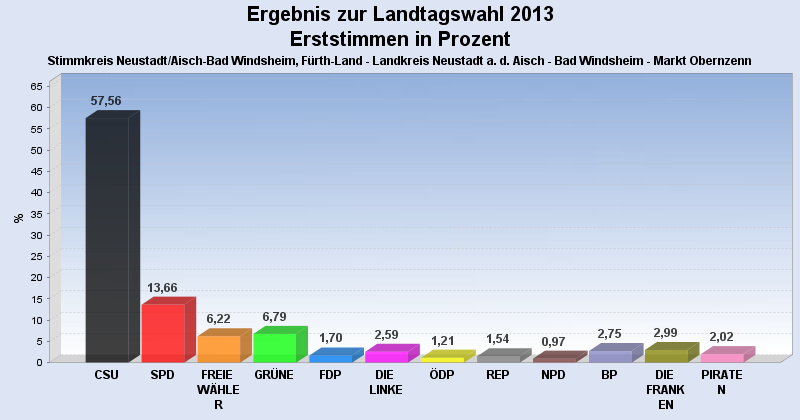
 Seitenanfang
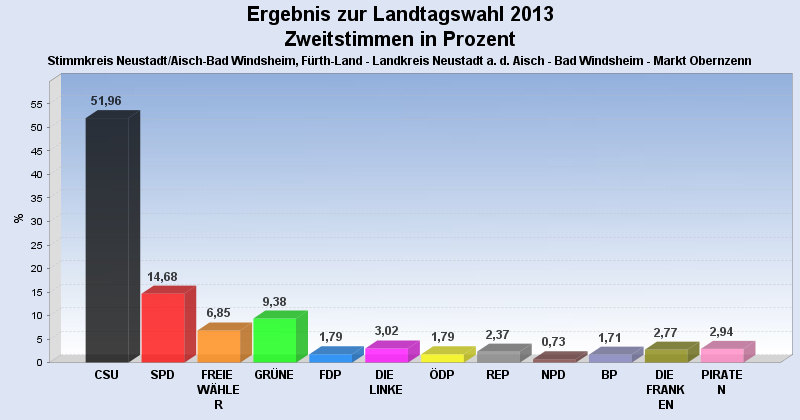
Wahlbeteiligung, Stimmzettel, Stimmen
| Wahlbeteiligung: | 60,12% |
|---|---|
| Stimmberechtigte: | 2.076 |
| Wähler: | 1.248 |
| Ungültige Erststimmen: | 11 |
| Gültige Erststimmen: | 1.237 |
| Ungültige Zweitstimmen: | 22 |
| Gültige Zweitstimmen: | 1.226 |
Erststimmen nach Wahlvorschlag
| Partei | Erststimmen | Prozent | |
|---|---|---|---|
| 1 | Herold, Hans ( CSU ) | 712 | 57,56% |
| 2 | Scheuenstuhl, Harry ( SPD ) | 169 | 13,66% |
| 3 | Schmidt, Gabi ( FREIE WÄHLER ) | 77 | 6,22% |
| 4 | Schwämmlein, Marianne ( GRÜNE ) | 84 | 6,79% |
| 5 | Peter, Thomas ( FDP ) | 21 | 1,70% |
| 6 | Förster, Henry ( DIE LINKE ) | 32 | 2,59% |
| 7 | Osterlänger, Jürgen ( ÖDP ) | 15 | 1,21% |
| 8 | Hegeler, Horst ( REP ) | 19 | 1,54% |
| 9 | Vahlberg, Richard ( NPD ) | 12 | 0,97% |
| 10 | Abele-Kloha, Heidi ( BP ) | 34 | 2,75% |
| 11 | Kistler, Karola ( DIE FRANKEN ) | 37 | 2,99% |
| 12 | Rosenberg, Raphael ( PIRATEN ) | 25 | 2,02% |
Zweitstimmen nach Wahlvorschlag
| Partei | Zweitstimmen | Prozent | |
|---|---|---|---|
| 1 | CSU | 637 | 51,96% |
| 2 | SPD | 180 | 14,68% |
| 3 | FREIE WÄHLER | 84 | 6,85% |
| 4 | GRÜNE | 115 | 9,38% |
| 5 | FDP | 22 | 1,79% |
| 6 | DIE LINKE | 37 | 3,02% |
| 7 | ÖDP | 22 | 1,79% |
| 8 | REP | 29 | 2,37% |
| 9 | NPD | 9 | 0,73% |
| 10 | BP | 21 | 1,71% |
| 11 | DIE FRANKEN | 34 | 2,77% |
| 12 | PIRATEN | 36 | 2,94% |
- Stand: 19.09.2013 10:08:14