OK.Wahl
Internetpräsentation
Version 2.2.7
Ergebnis zur Landtagswahl 2013 am 15.09.2013
Stimmkreis Neustadt/Aisch-Bad Windsheim, Fürth-Land - Landkreis Neustadt a. d. Aisch - Bad Windsheim - Gemeinde Gallmersgarten
Es wurden alle Stimmbezirke ausgewertet.
 Diagramm
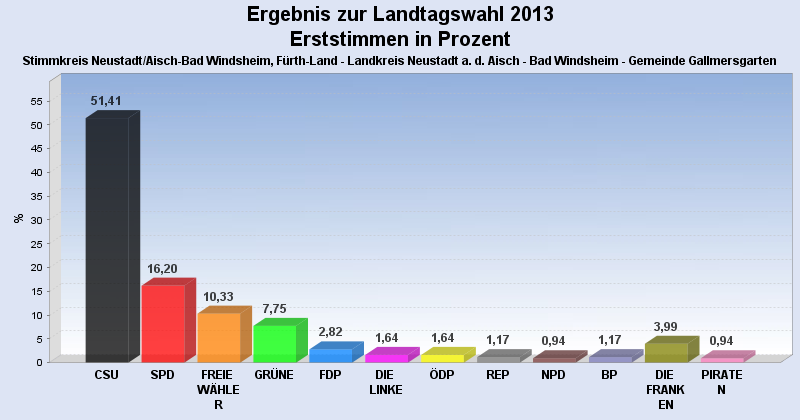
 Seitenanfang
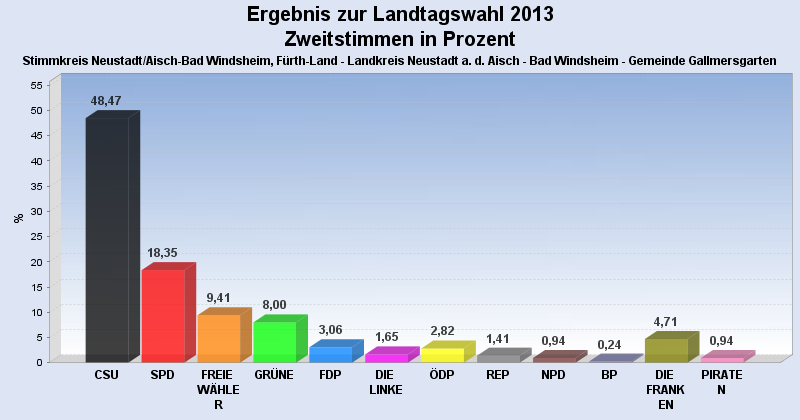
Wahlbeteiligung, Stimmzettel, Stimmen
| Wahlbeteiligung: | 70,39% |
|---|---|
| Stimmberechtigte: | 608 |
| Wähler: | 428 |
| Ungültige Erststimmen: | 2 |
| Gültige Erststimmen: | 426 |
| Ungültige Zweitstimmen: | 3 |
| Gültige Zweitstimmen: | 425 |
Erststimmen nach Wahlvorschlag
| Partei | Erststimmen | Prozent | |
|---|---|---|---|
| 1 | Herold, Hans ( CSU ) | 219 | 51,41% |
| 2 | Scheuenstuhl, Harry ( SPD ) | 69 | 16,20% |
| 3 | Schmidt, Gabi ( FREIE WÄHLER ) | 44 | 10,33% |
| 4 | Schwämmlein, Marianne ( GRÜNE ) | 33 | 7,75% |
| 5 | Peter, Thomas ( FDP ) | 12 | 2,82% |
| 6 | Förster, Henry ( DIE LINKE ) | 7 | 1,64% |
| 7 | Osterlänger, Jürgen ( ÖDP ) | 7 | 1,64% |
| 8 | Hegeler, Horst ( REP ) | 5 | 1,17% |
| 9 | Vahlberg, Richard ( NPD ) | 4 | 0,94% |
| 10 | Abele-Kloha, Heidi ( BP ) | 5 | 1,17% |
| 11 | Kistler, Karola ( DIE FRANKEN ) | 17 | 3,99% |
| 12 | Rosenberg, Raphael ( PIRATEN ) | 4 | 0,94% |
Zweitstimmen nach Wahlvorschlag
| Partei | Zweitstimmen | Prozent | |
|---|---|---|---|
| 1 | CSU | 206 | 48,47% |
| 2 | SPD | 78 | 18,35% |
| 3 | FREIE WÄHLER | 40 | 9,41% |
| 4 | GRÜNE | 34 | 8,00% |
| 5 | FDP | 13 | 3,06% |
| 6 | DIE LINKE | 7 | 1,65% |
| 7 | ÖDP | 12 | 2,82% |
| 8 | REP | 6 | 1,41% |
| 9 | NPD | 4 | 0,94% |
| 10 | BP | 1 | 0,24% |
| 11 | DIE FRANKEN | 20 | 4,71% |
| 12 | PIRATEN | 4 | 0,94% |
- Stand: 19.09.2013 10:07:08