OK.Wahl
Internetpräsentation
Version 2.2.7
Ergebnis zur Landtagswahl 2013 am 15.09.2013
Stimmkreis Neustadt/Aisch-Bad Windsheim, Fürth-Land - Landkreis Neustadt a. d. Aisch - Bad Windsheim - Markt Emskirchen
Es wurden alle Stimmbezirke ausgewertet.
 Diagramm
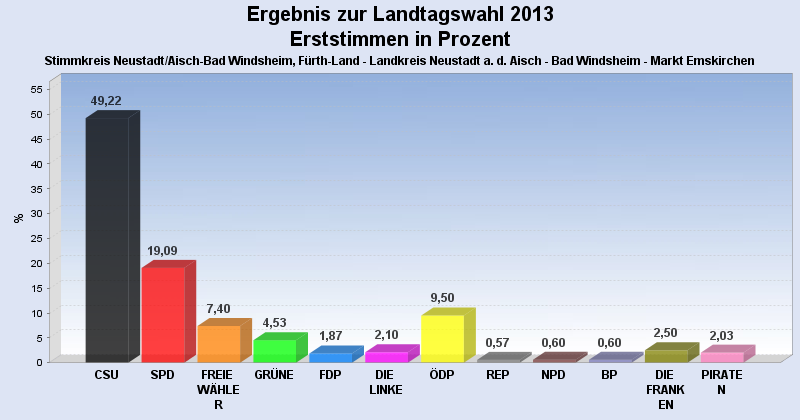
 Seitenanfang
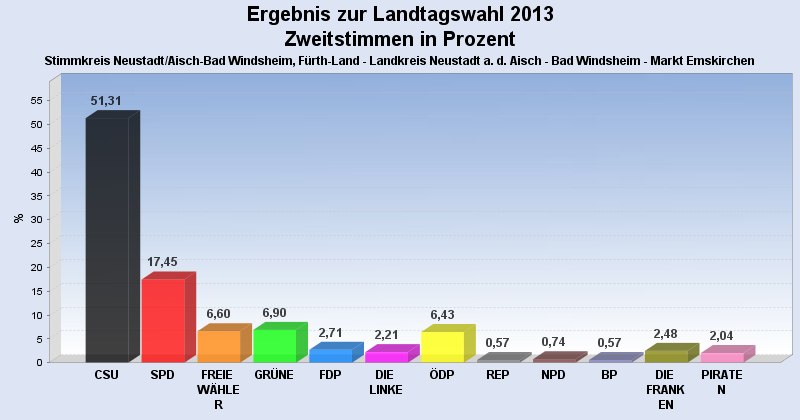
Wahlbeteiligung, Stimmzettel, Stimmen
| Wahlbeteiligung: | 64,85% |
|---|---|
| Stimmberechtigte: | 4.668 |
| Wähler: | 3.027 |
| Ungültige Erststimmen: | 26 |
| Gültige Erststimmen: | 3.001 |
| Ungültige Zweitstimmen: | 41 |
| Gültige Zweitstimmen: | 2.986 |
Erststimmen nach Wahlvorschlag
| Partei | Erststimmen | Prozent | |
|---|---|---|---|
| 1 | Herold, Hans ( CSU ) | 1.477 | 49,22% |
| 2 | Scheuenstuhl, Harry ( SPD ) | 573 | 19,09% |
| 3 | Schmidt, Gabi ( FREIE WÄHLER ) | 222 | 7,40% |
| 4 | Schwämmlein, Marianne ( GRÜNE ) | 136 | 4,53% |
| 5 | Peter, Thomas ( FDP ) | 56 | 1,87% |
| 6 | Förster, Henry ( DIE LINKE ) | 63 | 2,10% |
| 7 | Osterlänger, Jürgen ( ÖDP ) | 285 | 9,50% |
| 8 | Hegeler, Horst ( REP ) | 17 | 0,57% |
| 9 | Vahlberg, Richard ( NPD ) | 18 | 0,60% |
| 10 | Abele-Kloha, Heidi ( BP ) | 18 | 0,60% |
| 11 | Kistler, Karola ( DIE FRANKEN ) | 75 | 2,50% |
| 12 | Rosenberg, Raphael ( PIRATEN ) | 61 | 2,03% |
Zweitstimmen nach Wahlvorschlag
| Partei | Zweitstimmen | Prozent | |
|---|---|---|---|
| 1 | CSU | 1.532 | 51,31% |
| 2 | SPD | 521 | 17,45% |
| 3 | FREIE WÄHLER | 197 | 6,60% |
| 4 | GRÜNE | 206 | 6,90% |
| 5 | FDP | 81 | 2,71% |
| 6 | DIE LINKE | 66 | 2,21% |
| 7 | ÖDP | 192 | 6,43% |
| 8 | REP | 17 | 0,57% |
| 9 | NPD | 22 | 0,74% |
| 10 | BP | 17 | 0,57% |
| 11 | DIE FRANKEN | 74 | 2,48% |
| 12 | PIRATEN | 61 | 2,04% |
- Stand: 19.09.2013 10:06:53