OK.Wahl
Internetpräsentation
Version 2.2.7
Ergebnis zur Landtagswahl 2013 am 15.09.2013
Stimmkreis Neustadt/Aisch-Bad Windsheim, Fürth-Land - Landkreis Neustadt a. d. Aisch - Bad Windsheim - Markt Baudenbach
Es wurden alle Stimmbezirke ausgewertet.
 Diagramm
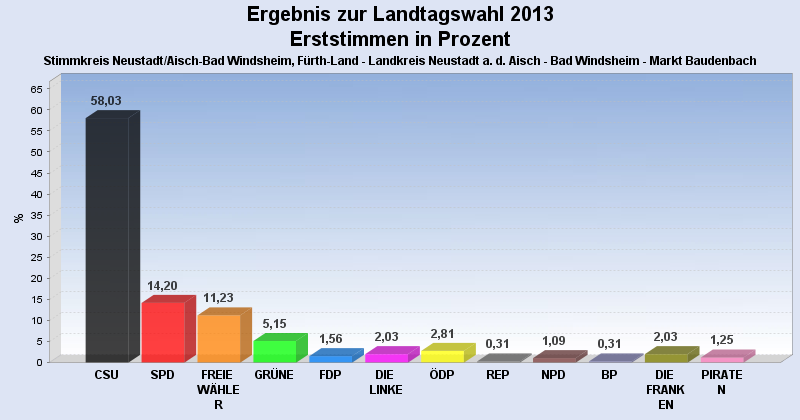
 Seitenanfang
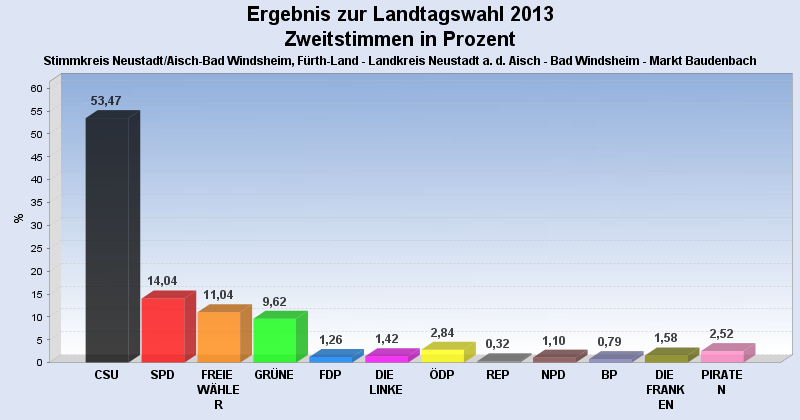
Wahlbeteiligung, Stimmzettel, Stimmen
| Wahlbeteiligung: | 72,11% |
|---|---|
| Stimmberechtigte: | 900 |
| Wähler: | 649 |
| Ungültige Erststimmen: | 8 |
| Gültige Erststimmen: | 641 |
| Ungültige Zweitstimmen: | 15 |
| Gültige Zweitstimmen: | 634 |
Erststimmen nach Wahlvorschlag
| Partei | Erststimmen | Prozent | |
|---|---|---|---|
| 1 | Herold, Hans ( CSU ) | 372 | 58,03% |
| 2 | Scheuenstuhl, Harry ( SPD ) | 91 | 14,20% |
| 3 | Schmidt, Gabi ( FREIE WÄHLER ) | 72 | 11,23% |
| 4 | Schwämmlein, Marianne ( GRÜNE ) | 33 | 5,15% |
| 5 | Peter, Thomas ( FDP ) | 10 | 1,56% |
| 6 | Förster, Henry ( DIE LINKE ) | 13 | 2,03% |
| 7 | Osterlänger, Jürgen ( ÖDP ) | 18 | 2,81% |
| 8 | Hegeler, Horst ( REP ) | 2 | 0,31% |
| 9 | Vahlberg, Richard ( NPD ) | 7 | 1,09% |
| 10 | Abele-Kloha, Heidi ( BP ) | 2 | 0,31% |
| 11 | Kistler, Karola ( DIE FRANKEN ) | 13 | 2,03% |
| 12 | Rosenberg, Raphael ( PIRATEN ) | 8 | 1,25% |
Zweitstimmen nach Wahlvorschlag
| Partei | Zweitstimmen | Prozent | |
|---|---|---|---|
| 1 | CSU | 339 | 53,47% |
| 2 | SPD | 89 | 14,04% |
| 3 | FREIE WÄHLER | 70 | 11,04% |
| 4 | GRÜNE | 61 | 9,62% |
| 5 | FDP | 8 | 1,26% |
| 6 | DIE LINKE | 9 | 1,42% |
| 7 | ÖDP | 18 | 2,84% |
| 8 | REP | 2 | 0,32% |
| 9 | NPD | 7 | 1,10% |
| 10 | BP | 5 | 0,79% |
| 11 | DIE FRANKEN | 10 | 1,58% |
| 12 | PIRATEN | 16 | 2,52% |
- Stand: 19.09.2013 10:06:30