OK.Wahl
Internetpräsentation
Version 2.2.7
Ergebnis zur Landtagswahl 2013 am 15.09.2013
Stimmkreis Neustadt/Aisch-Bad Windsheim, Fürth-Land - Landkreis Neustadt a. d. Aisch - Bad Windsheim - Stadt Bad Windsheim
Es wurden alle Stimmbezirke ausgewertet.
 Diagramm
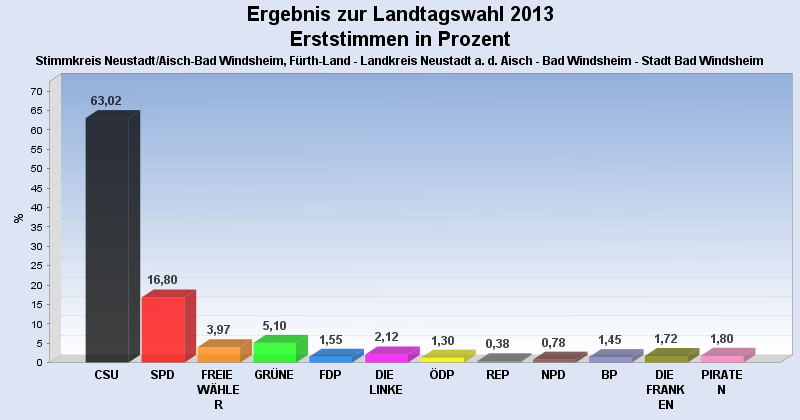
 Seitenanfang
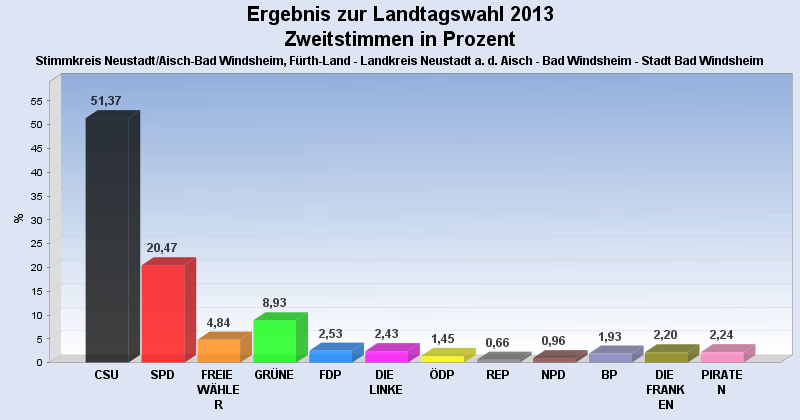
Wahlbeteiligung, Stimmzettel, Stimmen
| Wahlbeteiligung: | 57,49% |
|---|---|
| Stimmberechtigte: | 9.207 |
| Wähler: | 5.293 |
| Ungültige Erststimmen: | 59 |
| Gültige Erststimmen: | 5.233 |
| Ungültige Zweitstimmen: | 107 |
| Gültige Zweitstimmen: | 5.184 |
Erststimmen nach Wahlvorschlag
| Partei | Erststimmen | Prozent | |
|---|---|---|---|
| 1 | Herold, Hans ( CSU ) | 3.298 | 63,02% |
| 2 | Scheuenstuhl, Harry ( SPD ) | 879 | 16,80% |
| 3 | Schmidt, Gabi ( FREIE WÄHLER ) | 208 | 3,97% |
| 4 | Schwämmlein, Marianne ( GRÜNE ) | 267 | 5,10% |
| 5 | Peter, Thomas ( FDP ) | 81 | 1,55% |
| 6 | Förster, Henry ( DIE LINKE ) | 111 | 2,12% |
| 7 | Osterlänger, Jürgen ( ÖDP ) | 68 | 1,30% |
| 8 | Hegeler, Horst ( REP ) | 20 | 0,38% |
| 9 | Vahlberg, Richard ( NPD ) | 41 | 0,78% |
| 10 | Abele-Kloha, Heidi ( BP ) | 76 | 1,45% |
| 11 | Kistler, Karola ( DIE FRANKEN ) | 90 | 1,72% |
| 12 | Rosenberg, Raphael ( PIRATEN ) | 94 | 1,80% |
Zweitstimmen nach Wahlvorschlag
| Partei | Zweitstimmen | Prozent | |
|---|---|---|---|
| 1 | CSU | 2.663 | 51,37% |
| 2 | SPD | 1.061 | 20,47% |
| 3 | FREIE WÄHLER | 251 | 4,84% |
| 4 | GRÜNE | 463 | 8,93% |
| 5 | FDP | 131 | 2,53% |
| 6 | DIE LINKE | 126 | 2,43% |
| 7 | ÖDP | 75 | 1,45% |
| 8 | REP | 34 | 0,66% |
| 9 | NPD | 50 | 0,96% |
| 10 | BP | 100 | 1,93% |
| 11 | DIE FRANKEN | 114 | 2,20% |
| 12 | PIRATEN | 116 | 2,24% |
- Stand: 19.09.2013 10:06:16