OK.Wahl
Internetpräsentation
Version 2.2.7
Ergebnis zur Landtagswahl 2013 am 15.09.2013
Stimmkreis Neustadt/Aisch-Bad Windsheim, Fürth-Land - Landkreis Fürth - Markt Wilhermsdorf
Es wurden alle Stimmbezirke ausgewertet.
 Diagramm
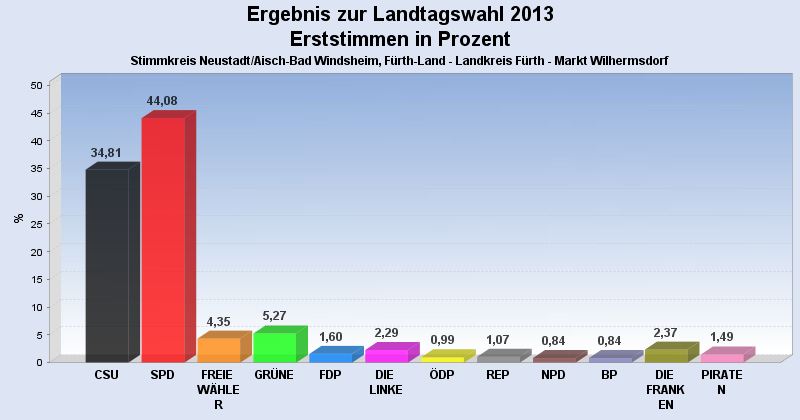
 Seitenanfang
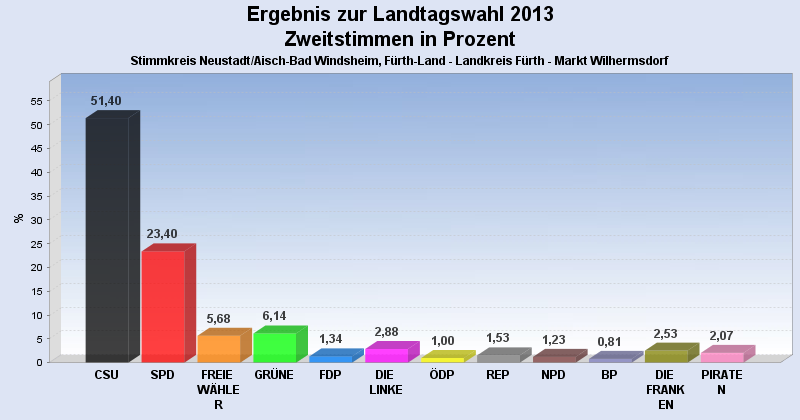
Wahlbeteiligung, Stimmzettel, Stimmen
| Wahlbeteiligung: | 67,88% |
|---|---|
| Stimmberechtigte: | 3.898 |
| Wähler: | 2.646 |
| Ungültige Erststimmen: | 26 |
| Gültige Erststimmen: | 2.620 |
| Ungültige Zweitstimmen: | 39 |
| Gültige Zweitstimmen: | 2.607 |
Erststimmen nach Wahlvorschlag
| Partei | Erststimmen | Prozent | |
|---|---|---|---|
| 1 | Herold, Hans ( CSU ) | 912 | 34,81% |
| 2 | Scheuenstuhl, Harry ( SPD ) | 1.155 | 44,08% |
| 3 | Schmidt, Gabi ( FREIE WÄHLER ) | 114 | 4,35% |
| 4 | Schwämmlein, Marianne ( GRÜNE ) | 138 | 5,27% |
| 5 | Peter, Thomas ( FDP ) | 42 | 1,60% |
| 6 | Förster, Henry ( DIE LINKE ) | 60 | 2,29% |
| 7 | Osterlänger, Jürgen ( ÖDP ) | 26 | 0,99% |
| 8 | Hegeler, Horst ( REP ) | 28 | 1,07% |
| 9 | Vahlberg, Richard ( NPD ) | 22 | 0,84% |
| 10 | Abele-Kloha, Heidi ( BP ) | 22 | 0,84% |
| 11 | Kistler, Karola ( DIE FRANKEN ) | 62 | 2,37% |
| 12 | Rosenberg, Raphael ( PIRATEN ) | 39 | 1,49% |
Zweitstimmen nach Wahlvorschlag
| Partei | Zweitstimmen | Prozent | |
|---|---|---|---|
| 1 | CSU | 1.340 | 51,40% |
| 2 | SPD | 610 | 23,40% |
| 3 | FREIE WÄHLER | 148 | 5,68% |
| 4 | GRÜNE | 160 | 6,14% |
| 5 | FDP | 35 | 1,34% |
| 6 | DIE LINKE | 75 | 2,88% |
| 7 | ÖDP | 26 | 1,00% |
| 8 | REP | 40 | 1,53% |
| 9 | NPD | 32 | 1,23% |
| 10 | BP | 21 | 0,81% |
| 11 | DIE FRANKEN | 66 | 2,53% |
| 12 | PIRATEN | 54 | 2,07% |
- Stand: 19.09.2013 10:06:08