OK.Wahl
Internetpräsentation
Version 2.2.7
Ergebnis zur Landtagswahl 2013 am 15.09.2013
Stimmkreis Neustadt/Aisch-Bad Windsheim, Fürth-Land - Landkreis Fürth - Gemeinde Obermichelbach
Es wurden alle Stimmbezirke ausgewertet.
 Diagramm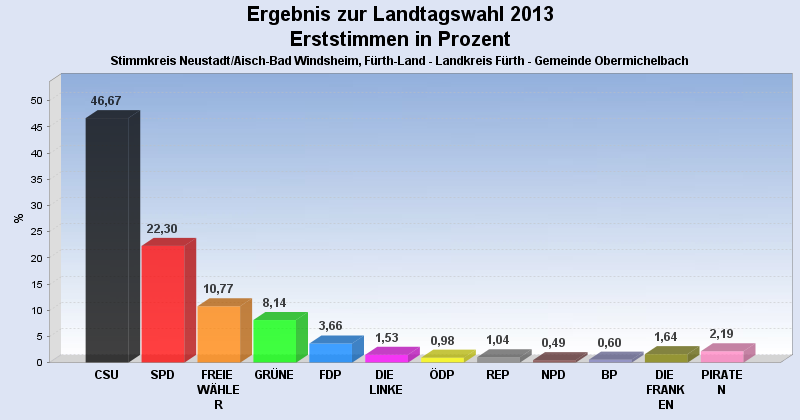
 Seitenanfang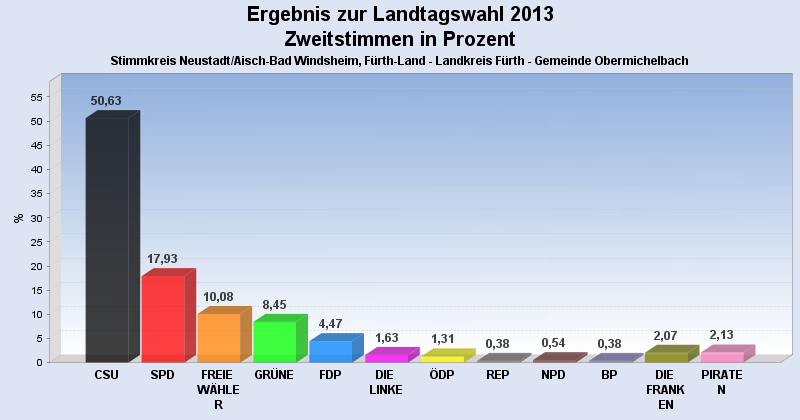
Wahlbeteiligung, Stimmzettel, Stimmen
| Wahlbeteiligung: | 73,59% |
|---|---|
| Stimmberechtigte: | 2.518 |
| Wähler: | 1.853 |
| Ungültige Erststimmen: | 23 |
| Gültige Erststimmen: | 1.830 |
| Ungültige Zweitstimmen: | 18 |
| Gültige Zweitstimmen: | 1.835 |
Erststimmen nach Wahlvorschlag
| Partei | Erststimmen | Prozent | |
|---|---|---|---|
| 1 | Herold, Hans ( CSU ) | 854 | 46,67% |
| 2 | Scheuenstuhl, Harry ( SPD ) | 408 | 22,30% |
| 3 | Schmidt, Gabi ( FREIE WÄHLER ) | 197 | 10,77% |
| 4 | Schwämmlein, Marianne ( GRÜNE ) | 149 | 8,14% |
| 5 | Peter, Thomas ( FDP ) | 67 | 3,66% |
| 6 | Förster, Henry ( DIE LINKE ) | 28 | 1,53% |
| 7 | Osterlänger, Jürgen ( ÖDP ) | 18 | 0,98% |
| 8 | Hegeler, Horst ( REP ) | 19 | 1,04% |
| 9 | Vahlberg, Richard ( NPD ) | 9 | 0,49% |
| 10 | Abele-Kloha, Heidi ( BP ) | 11 | 0,60% |
| 11 | Kistler, Karola ( DIE FRANKEN ) | 30 | 1,64% |
| 12 | Rosenberg, Raphael ( PIRATEN ) | 40 | 2,19% |
Zweitstimmen nach Wahlvorschlag
| Partei | Zweitstimmen | Prozent | |
|---|---|---|---|
| 1 | CSU | 929 | 50,63% |
| 2 | SPD | 329 | 17,93% |
| 3 | FREIE WÄHLER | 185 | 10,08% |
| 4 | GRÜNE | 155 | 8,45% |
| 5 | FDP | 82 | 4,47% |
| 6 | DIE LINKE | 30 | 1,63% |
| 7 | ÖDP | 24 | 1,31% |
| 8 | REP | 7 | 0,38% |
| 9 | NPD | 10 | 0,54% |
| 10 | BP | 7 | 0,38% |
| 11 | DIE FRANKEN | 38 | 2,07% |
| 12 | PIRATEN | 39 | 2,13% |
- Stand: 19.09.2013 10:05:36