OK.Wahl
Internetpräsentation
Version 2.2.7
Ergebnis zur Landtagswahl 2013 am 15.09.2013
Stimmkreis Neustadt/Aisch-Bad Windsheim, Fürth-Land - Landkreis Fürth - Gemeinde Großhabersdorf
Es wurden alle Stimmbezirke ausgewertet.
 Diagramm
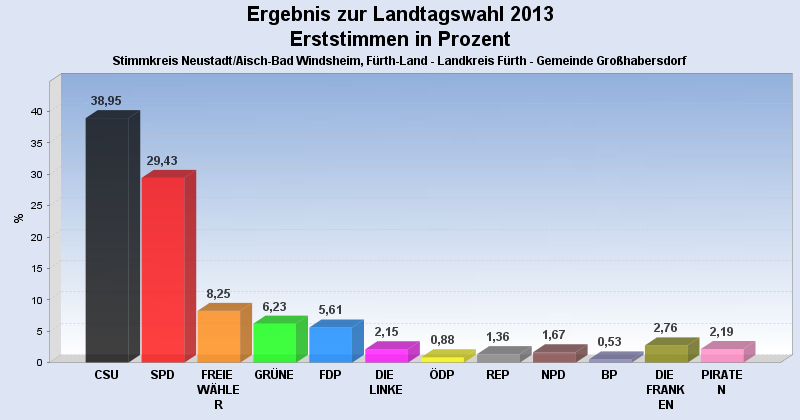
 Seitenanfang
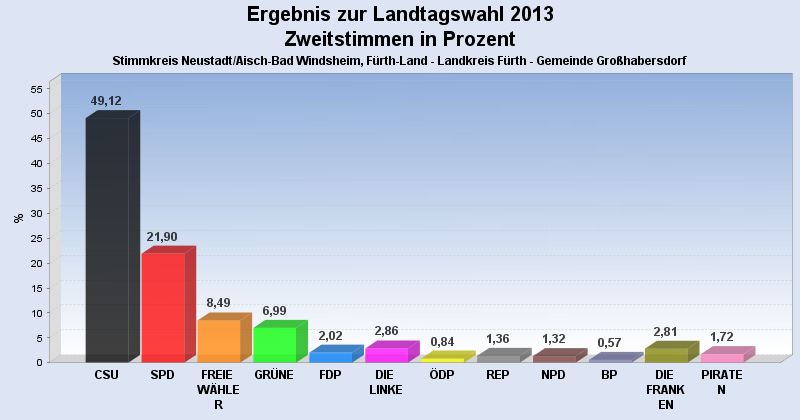
Wahlbeteiligung, Stimmzettel, Stimmen
| Wahlbeteiligung: | 70,33% |
|---|---|
| Stimmberechtigte: | 3.276 |
| Wähler: | 2.304 |
| Ungültige Erststimmen: | 24 |
| Gültige Erststimmen: | 2.280 |
| Ungültige Zweitstimmen: | 30 |
| Gültige Zweitstimmen: | 2.274 |
Erststimmen nach Wahlvorschlag
| Partei | Erststimmen | Prozent | |
|---|---|---|---|
| 1 | Herold, Hans ( CSU ) | 888 | 38,95% |
| 2 | Scheuenstuhl, Harry ( SPD ) | 671 | 29,43% |
| 3 | Schmidt, Gabi ( FREIE WÄHLER ) | 188 | 8,25% |
| 4 | Schwämmlein, Marianne ( GRÜNE ) | 142 | 6,23% |
| 5 | Peter, Thomas ( FDP ) | 128 | 5,61% |
| 6 | Förster, Henry ( DIE LINKE ) | 49 | 2,15% |
| 7 | Osterlänger, Jürgen ( ÖDP ) | 20 | 0,88% |
| 8 | Hegeler, Horst ( REP ) | 31 | 1,36% |
| 9 | Vahlberg, Richard ( NPD ) | 38 | 1,67% |
| 10 | Abele-Kloha, Heidi ( BP ) | 12 | 0,53% |
| 11 | Kistler, Karola ( DIE FRANKEN ) | 63 | 2,76% |
| 12 | Rosenberg, Raphael ( PIRATEN ) | 50 | 2,19% |
Zweitstimmen nach Wahlvorschlag
| Partei | Zweitstimmen | Prozent | |
|---|---|---|---|
| 1 | CSU | 1.117 | 49,12% |
| 2 | SPD | 498 | 21,90% |
| 3 | FREIE WÄHLER | 193 | 8,49% |
| 4 | GRÜNE | 159 | 6,99% |
| 5 | FDP | 46 | 2,02% |
| 6 | DIE LINKE | 65 | 2,86% |
| 7 | ÖDP | 19 | 0,84% |
| 8 | REP | 31 | 1,36% |
| 9 | NPD | 30 | 1,32% |
| 10 | BP | 13 | 0,57% |
| 11 | DIE FRANKEN | 64 | 2,81% |
| 12 | PIRATEN | 39 | 1,72% |
- Stand: 19.09.2013 10:05:17